Cell Cycle Kit Performance
To increase the confidence in DNA content analysis, the amount of variation measured (coefficient of variation) on the G0/G1 peak should be monitored. Values below 3% are considered optimal with values in excess of 6% on non-tumor cells being unacceptable (Darzynkiewicz et al). Error is introduced in the technique, during cell preparation and staining steps as well as acquisition on the flow cytometer. One source of error is attributed to inconsistent access of the staining reagent to the nuclear DNA. Using a formaldehyde-derived fixation in a no wash staining protocol that provides robust staining compatible with the common automated analysis via cell cycle determination algorithms. Because of the overlap between G1 and early S Phase and the overlap of G2/M and late S Phase the manual analysis of cell cycle data remain tedious and subject to variability. Several flow cytometry software packages include algorithms to assist users with modeling cell cycle data. Data presented below have been analyzed using the JV Watson algorithm, one of the two algorithms included with Kaluza Analysis version 2.0.
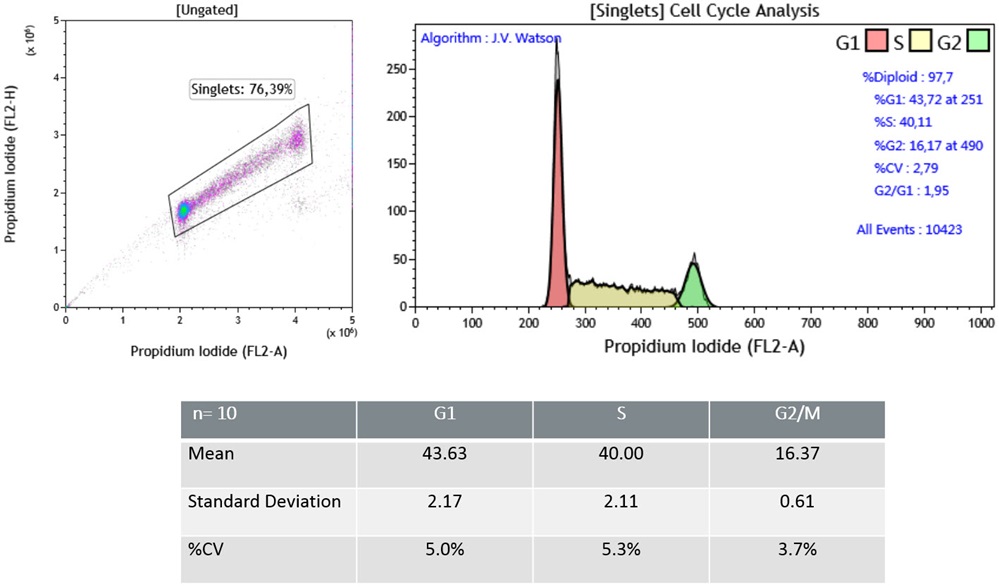
Univariate analysis of Jurkat Cell Line.(A) Representative data obtained with Cell Cycle Kit. (B) A table summarizing data obtained with a sample stained multiple times (n=10). The univariate Cell Cycle analysis using DNA content demonstrated that the optimized fixation workflow associated to the cell cycle kit allows (i) a good recovery of singlet events (about 70%), (ii) good data resolution with a CV (G0/G1 peak) >3% and (iii) good reproducibility with a %CV <5% for the cells of interest.
Pozarowski and Z. Darzynkiewicz. "Analysis of Cell Cycle by Flow Cytometry," Methods Mol Biol 281(2): 301-311, 2004.
*For Research Use Only. Not for use in diagnostic procedures.
