Preparation and purification of carbon nanotubes using an ultracentrifuge and automatic dispensing apparatus, and analysis using an analytical centrifuge system
Abstract
In this Application Note, we will introduce a quick and reliable method to be used when increasing the scale of nanoparticle purification and we will also introduce quantitative analysis of the concentration of the particle species present, focusing on these two difficult fields related to nanoparticles.
By using the automatic dispensing apparatus Biomek 4000 Workstation, which is a laboratory automation system, it will be possible to inhibit differences between operators in order to prepare a large quantity of density gradient in a stable and reproducible manner. Preparative Ultracentrifugation is a separation method that boasts extremely high reproducibility due to its stable ultracentrifugation performance. Analytical Ultracentrifugation (AUC) can be used for measurements of low concentration or low volume samples, making it ideal for the analysis of nanoparticles such as nanotubes, quantum dots and graphene. Also, this is an analytical apparatus that can obtain a variety of useful information regarding the properties of nanoparticles within solution.
Introduction
Single-walled carbon nanotubes (SWCNT) are a material that has attracted interest these last 15 years from the standpoint of semiconductors1 , fuel cells2 , and biomedical applications.3 However, we are faced with two major issues in each field. The first issue is the fact that synthesized SWCNT could include a large number of carbon impurities and multi-walled carbon nanotubes (MWCNT). Additionally, there is no reliable method to assay the ratio of carbon nanotubes other than SWCNT.4 The second issue is the fact that SWCNT is synthesized in a state in which there is a
mixture of a variety of arrangements for the carbon atoms [this is known as chirality (n, m)] (Fig. 1). 5 SWCNT with different chirality will show significant differences in the optical properties and electrical properties. 6, 7 The properties of SWCNT are derived from the properties of graphene, which forms the basic foundation of SWCNT, so the structure of SWCNT can be defined based on the graphene skeleton using two integers known as the chiral index. SWNT is known to show metallic properties or semiconduction based on is geometric structure, which may be determined by its chiral index (n, m). For multiples of n - m = 3, the material will be metallic SWNT, while materials not showing a multiple of n - m = 3 will be semiconductive SWNT. Therefore, there is a need for a method to separate large volumes of SWCNT with homogenous and uniform chirality following synthesis, and in particular, this is becoming a major issue in semiconductors (the on/off ratio of the semiconductive properties will fall greatly if there is contamination of metallic SWCNT 8 ) and in in vivo drug delivery and imaging applications. 9-11 Electron microscopes were primarily utilized in the early attempts to measure impurities of SWCNT in solution, but it is not possible to achieve statistical significance with electron microscopes, and the results may be impacted by the subjectivity of the observer, making it difficult to differentiate between double-walled carbon nanotubes (DWCNT) with a diameter of 3 nm and SWCNT with a diameter of 1 nm. As a means of resolving these impurities problems, research was conducted on ultraviolet-visible absorption spectrophotometry, near-infrared fluorescence spectroscopy, and Raman spectroscopy, but unfortunately, these techniques each have their own unique disadvantages, making them insufficient for use as a means of quantitatively analyzing SWCNT impurities.4
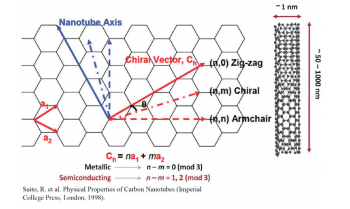
Fig. 1 Schematic diagram of single-walled carbon nanotubes
One of the most effective methods currently available for individual chirality separation of SWCNT is the Density Gradient Ultracentrifugation
One of the most effective methods currently available for individual chirality separation of SWCNT is the Density Gradient Ultracentrifugation (DGU) method. 12, 13 The DGU method can obtain (6, 5) SWCNT with a purity of 99%, which is an extremely desirable level of purity. However, in the DGU method, preparation of the solvent gradient is performed using the conventional manual operations, which is a major obstacle when increasing the scale, or in other words, when preparing a large number of specimens such as several tens of specimens.
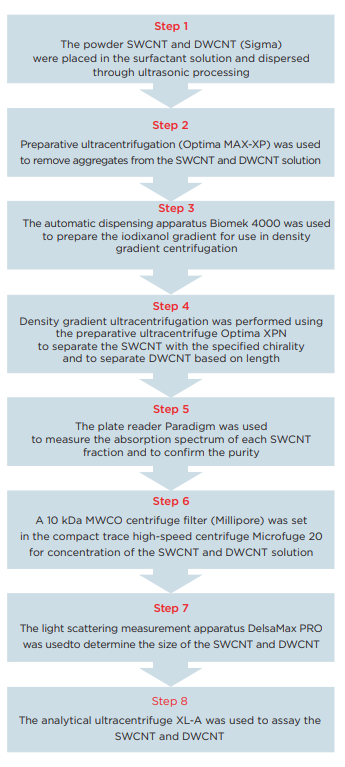
In this Application Note, we will propose a work flow to use ultraviolet-visible absorption spectrophotometry to confirm the separation of a large volume of nonuniform SWCNT into individual (6, 5) chirality in a rapid and highly reproducible manner. This work flow is primarily characterized by the fact that large aggregated carbon nanotubes are removed as a result of ultracentrifugation processing (Optima MAX-XP) for 3 minutes, and then, after preparing a density gradient using the automatic dispensing apparatus Biomek 4000, the ultracentrifuge Optima X series is used to purify the SWCNT and DWCNT through density gradient ultracentrifugation. Automating the density gradient preparation will improve the precision and reproducibility of the density gradient in comparison to manual operations. In the separation of SWCNT, the concentration gradient step at the start will only differ by approximately ±1% g/mL, so the precision of the solvent preparation for use in the density gradient will be important. In the case of manual operations, the gradient may be disturbed, but there are no such concerns when the operations are automated. In the latter half of this Application Note, we will present a method to quantitatively identify SWCNT and DWCNT that was separated based on length using an analytical ultracentrifuge system (AUC). To date, AUC has primarily been used in the analysis of proteins, but the analytical performance of AUC is ideal for use in the analysis of the properties of nanoparticles. AUC can be used to determine the nanoparticle sedimentation coefficient, diffusion coefficient and friction coefficient under a variety of solvent conditions, so AUC can provide information that cannot be obtained using an electron microscope or optical spectroscopy analysis methods in the analysis of nanomaterials. 14, 15
AUC can provide information that cannot be obtained using an electron microscope or optical spectroscopy analysis methods in the analysis of nanomaterials.
Experimental procedure
Preparation of a gradient for the density gradient
Biomek 4000 was used with a P-1000SL single pipetter tool and P1000 wide-bore tips to prepare the density gradient. Highly flexible control software was utilized, making it possible to easily establish not only the number of tubes to be prepared, but also the volume of each gradient. The centrifuge tubes (Beckman Coulter, Serial No. 331372) were set in a 24-hole tube rack, which was placed on top of the Biomek deck. The liquid level detection function of the tool was used in order to minimize disruption of the interface during preparation of the gradient, and the solution was dispensed at an extremely slow speed. This time, gradient layers such as those shown in Table 1 were prepared.
Table 1 Composition of the density gradient for homogenous chirality separation
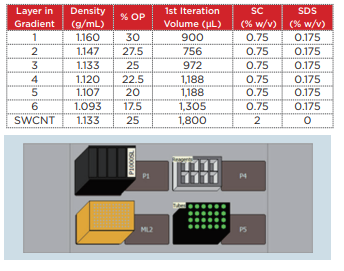
Fig. 2 Deck layout of the Biomek 4000 workstation
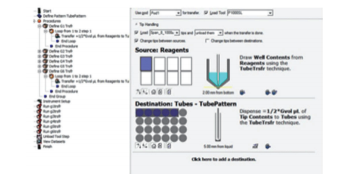
Fig. 3 Method screen for preparation of the density gradient New preparation of a dispensation technique to avoid disruption of the interface during preparation of the gradient; For dispensing into the centrifuges, the height was indicated in units of 0.1 mm.
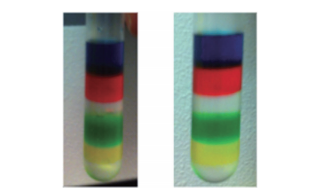
Fig. 4 Use of iodixanol colored with food coloring to confirm the gradient preparation
Manual preparation (left) and preparation using the Biomek 4000 Workstation (right) was compared. It was possible to clearly confirm each layer of the gradient
Purification of the single-walled carbon nanotubes (SWCNT) 16
20 mg of the SWCNT was placed within a 20 mL glass vial containing a 2% sodium cholate (SC) aqueous solution (deionized water), and a Branson M1800H ultrasonic cleaner was used to perform ultrasonic processing for 1 hour. In order to precipitate and remove large aggregates from this SWCNT solution, the material was placed into open-top thick polycarbonate centrifuge tubes (Beckman Coulter, Serial No. 362305) and centrifuged for 3 minutes at 22°C and 55,000 rpm (approximately 164,000 xg) using an Optima MAXXP table-top ultracentrifuge with a TLA 110 rotor. Taking care not to destroy the pellets, 1,100 µL of the supernatant was carefully recovered for use in the density gradient centrifugation. 1.8 mL of the SWCNT solution that was prepared to a density of 1.13 g/mL (25% OP) using 2% SC+Optiprep was injected between the 27.5% and 25% Optiprep layers (AXIS-S HIELD, domestic dealer: Cosmo Bio Co., Ltd.) of a density gradient tube that was filled in advance. In order to align the balance of these centrifuge tubes, deionized water with the same surface activity concentration as Optiprep was used to fill the tubes to within 2 ~ 3 mm of the top edge of the tubes. Then, a SW 41 Ti rotor was used in the Optima XPN to centrifuge the material at 22°C and 41,000 rpm (approximately 288,000 xg) for 32 hours. Centrifugation was performed using the minimum acceleration and deceleration. Following centrifugation, a syringe was used to remove the topmost 2 mL, taking care not to disrupt the lower layer. The remaining portion that included the (6, 5) SWCNT was divided into 150 µL fractions (Fig. 5).
Purification of the double-walled carbon nanotubes (DWCNT)
20 mg of the DWCNT was placed within a 20 mL glass vial containing a 2% sodium cholate (SC) aqueous solution (deionized water), and a Branson M1800H ultrasonic cleaner was used to perform ultrasonic processing for 1 hour. In order to precipitate and remove large aggregates from this DWCNT solution, the material was placed into open-top thick polycarbonate centrifuge tubes (Beckman Coulter, Serial No. 362305) and centrifuged for 3 minutes at 22°C and 27,000 rpm (approximately 40,000 xg) using an Optima MAX-XP ultracentrifuge with a TLA 110 rotor. Taking care not to destroy the pellets, 1,300 µL of the supernatant was carefully recovered for use in the density gradient centrifugation. In order to perform fractionation of the DWCNT based on differences in length, the density gradient shown in Table 2 was prepared within a polyallomer centrifuge tube (Beckman Coulter, Serial No. 331372). 1,300 µL of the DWCNT solution that was recovered previously was superposed onto the resultant gradient. In order to ensure balance between these centrifuge tubes, a 2% SC aqueous solution (deionized water) was added to the tubes to within 2 ~ 3 mm of the top edge of the tubes. Then, a SW 41 Ti rotor was used in the Optima XPN with a 2-step program to centrifuge the material at 22°C and 15,000 rpm (approximately 38,500 xg) for 1 hour, and then at 30,500 rpm (approximately 159,500 xg) for 1 hour. Rotor acceleration and deceleration were kept to the minimum. After centrifugation, 600 µL fractions were collected from the top to the bottom of each tube, and 4 ~ 6 fractions were used (Fig. 6).
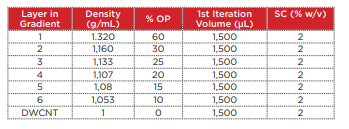
Table 2 Composition of the density gradient for separation of the double-walled carbon nanotubes
Fraction analysis
For each SWCNT fraction, a Molecular Device Paradigm plate reader was used to measure the wavelengths within the range of 400 ~ 1,000 nm in order to confirm the ultraviolet, visible and near-infrared absorption. The decision was made to use fractions showing the largest absorption peaks at 570 nm and 990 nm and showing minimal absorption peaks at the other wavelengths in the rest of the experiment.
Dialysis
SWCNT: After fractionation, each (6, 5) chirality SWCNT fraction that had been separated was subjected to dialysis using a cellulose membrane (3.5 kDa MWCO) within 1% SC in order to remove the iodixanol (Optiprep) and sodium dodecyl sulfate from the SWCNT solution and to re-coat the SWCNT with the surfactant. The extracellular fluid was replaced 8 times at intervals of at least 4 hours. The solution obtained following dialysis was concentrated using a compact trace high-speed centrifuge Microfuge 20 (Beckman Coulter) with an Amicon ultracentrifuge filter (Millipore).
DWCNT: The same procedure was used to process the fractionated DWCNT solution.
Sedimentation measurement experiment (ultracentrifuge analysis)
The analytical ultracentrifuge system ProteomeLab XL-A was used to measure the SWCNT and DWCNT solutions. The concentrated (6, 5) chirality SWCNT sample had absorbance of 0.85 at 570 nm, and the sample was injected into a measurement cell having a quartz window and 12 mm Epon charcoal-filled double sector center piece. A 1% SC aqueous solution (the extracellular solution during dialysis) was used as the reference solution. The sample volume was 370 µL, while the reference volume was 380 µL. The DWCNT sample (570 nm, absorbance 0.85) that had been fractionated based on length was injected into the second cell, while the SWCNT/DWCNT (50%/50%) mixture showing absorption at 570 nm was injected into the third cell. The centrifugation conditions were 22°C and 27,000 rpm for 4 hours for 17, with the experiment initially conducted on the sample showing absorbance of 0.6 at 570 nm in order to confirm the concentration dependence.
Sedimentation measurement experiment (ultracentrifuge analysis)
The analysis was conducted using SEDFIT, which is analytical software that is capable of model fitting based on the Lamm equation. As is also noted in the research by Arnold et al, an analysis that uses the Lamm equation can be used to evaluate component in consideration of dispersion as well. 17 By comparing the sedimentation coefficients for SWCNT and DWCNT, it was also possible to confirm the ability to differentiate SWCNT and DWCNT within solution using analytical ultracentrifugation.
Particle size distribution analysis using dynamic light scattering
The DWCNT that was fractionated based on length and the (6, 5) chirality SWCNT were each analyzed using a nanoparticle diameter measurement system DelsaMax CORE (a simultaneous measurement system that uses dynamic light scattering and passive light scattering) (Beckman Coulter). Approximately 10 µL was placed into a quartz cuvette, and the measurements were repeated 10 times, once every 5 seconds at 25°C.
Results
It is clear from Fig. 5 that it is easy to separate SWCNT using the DGU method. Prior to the ultracentrifugation (Fig. 5a), SWCNT was confirmed to be a black solution. This is because there was a mixture of various chirality having absorption peaks spread over the visible range. Following ultracentrifugation, the individual chirality appeared as colored bands (a band-shaped streak) (Fig. 5b). The purple band at the top includes the (6, 5) SWCNT, and was recovered for use in the AUC analysis. SWCNT has van Hove singularities in the nearinfrared and visible regions, and the (6,5) SWCNT with the surfactant coating within the SC solution should, theoretically, generate peaks at 570 ~ 580 nm and 980 ~ 990 nm. 16 The absorbance spectrum in Fig. 7 was obtained by measuring the sample after dialysis and concentration of the (6,5) SWCNT within the 1% SC solution. There are large peaks at 571 nm and 990 nm, and because no strong absorption is observed at the other wavelengths, it is possible to confirm the purity of the SWCNT with concentrated (6, 5) chirality. The DWCNT was fractionated based on length following processing using the same procedure as that used for the SWCNT. 18 The topmost fraction in Fig. 6b is believed to contain DWCNT, the majority of which is not bundled together. Based on the dynamic light scattering data (Fig. 8), DWCNT has a diffusion coefficient of 2.1×10⁻⁸ cm2 /s, indicating that the mean length is approximately 200 nm.
When using the dynamic light scattering method conducted using the DelsaMax CORE, it is clear that it will be difficult to differentiate between single-walled carbon nanotubes and double-walled carbon nanotubes (Fig. 8). DWCNT and SWCNT have extremely different optical properties such as absorption (Fig. 7) and fluorescence 19, but they are extremely similar in terms of the physical diameter or density. Each has a length between 100 ~ 1,000 nm, and the diameter is also close (SWCNT is approximately 1 nm, DWCNT is approximately 2 ~ 3.5 nm 19). Therefore, it is difficult to differentiate between the two using techniques such as light scattering. Further, it is difficult to obtain resolution in the height direction as required to accurate differentiate SWCNT and DWCNT using an electron microscope, and even when measuring several hundred particles within a solution containing more than 1018 nanotubes, the values would not be representative.
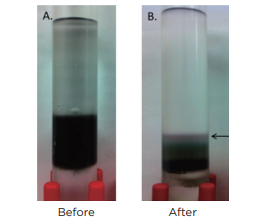
Fig. 5 Separation of (6, 5) SWCNT based on chirality
The photographs show the SWCNT sample prior to (5A) and after (5B) density gradient ultracentrifugation. 0.2 mL was recovered from the purple portion (indicated by the arrow), and absorption spectrophotometry was performed, confirming that the material has an absorbance peak at 575 nm.
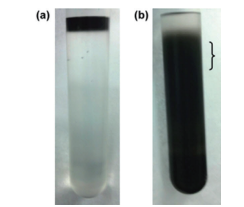
Fig. 6 Separation of DWCNT based on length
The photographs show the DWCNT sample prior to (6a) and after (6b) density gradient ultracentrifugation. The material was divided into 0.6 mL fractions, and 4 ~ 6 fractions were used in the analysis. The approximate position of Fractions 4 ~ 6 is indicated by the bracket (}).
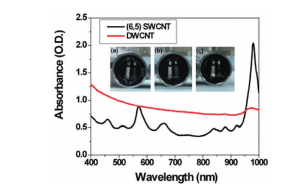
Fig. 7 Absorption plot of the double-walled carbon nanotubes (DWCNT, red curve) fractionated and concentrated based on length and the single-walled carbon nanotubes (SWCNT, black curve) concentrated based on chirality
The photograph shows the AUC cells, and the sector on the left side contains the reference solution, while the sector on the right side contains the sample solution. (a) contains only DWCNT. (b) contains primarily (6, 5) SWCNT, and this is demonstrated based on the tall peaks at 570 and 980 nm. (c) contains a mixed solution prepared to have 50%/50% of DWCNT and SWCNT.
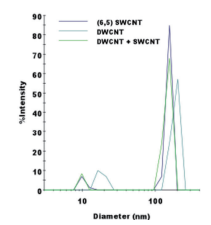
Fig. 8 Representative dynamic light scattering data obtained using the DelsaMax CORE
There is a peak due to the carbon nanotubes near a diameter of more than 100 nm, and the peak near a diameter of 10 nm is due to the surfactant micelle. It was not possible to differentiate between SWCNT and DWCNT using dynamic light scattering.
With analytical ultracentrifugation, it will be possible to easily differentiate between SWCNT and DWCNT.
With analytical ultracentrifugation, it will be possible to easily differentiate between SWCNT and DWCNT (Fig. 9). DWCNT is not easily coated with a surfactant using sodium cholate, so it showed extremely rapid sedimentation within the SC buffer solution during ultracentrifugation, showing a sedimentation coefficient of 80.4 ± 25.6 S (Fig. 9b, 10b). In comparison, as has been reported in the literature in the past 17, 20, SWCNT showed slow sedimentation, with a sedimentation coefficient of 11.3 S (Fig. 9a, 10a). In order to confirm the resolution of the AUC, a mixed solution of SWCNT and DWCNT was prepared, and an attempt was made to separate these materials. 175 µL each of a SWCNT solution and a DWCNT solution with absorbance of 0.894 at 570 nm were mixed together and analyzed using AUC (Fig. 9c). In the case of (6, 5) SWCNT alone, the sedimentation coefficient was 5 ~ 30 S (Fig. 10a), while the sedimentation coefficient of the DWCNT that was fractionated based on length was 30 ~ 140 S (Fig. 10b). Therefore, based on the sedimentation coefficient distribution plot using 30 S as the cut-off value (Fig. 10c), it was possible to quantitatively demonstrate that the 50%/50% mixed solution contained 50.4% SWCNT and 49.6% DWCNT. There is no other analytical technique that is capable of quantitative evaluation of SWCNT and DWCNT like this. In order to confirm the quantification capabilities of the AUC, an attempt was made to prepare two separate types of SWCNT and DWCNT mixed solutions. The 29% SWCNT/71% DWCNT solution according to the absorbance was determined to have a ratio of 28.3%/71.7% based on the sedimentation coefficient distribution (Fig. 10d). Similarly, the 71.4% SWCNT/28.6% DWCNT solution according to the absorbance was determined to have a ratio of 64.7%/35.3% based on the sedimentation coefficient distribution (this data is not shown).
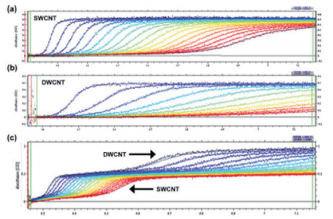
Fig. 9 SEDFIT analysis of the AUC measurement data
(9a) shows the (6, 5) SWCNT raw data and fitting results. (9b) shows the raw data for the DWCNT fractionated based on length, and the fitting results. (9c) shows the raw data for the (6, 5) SWCNT and DWCNT mixed solution, and the fitting results.
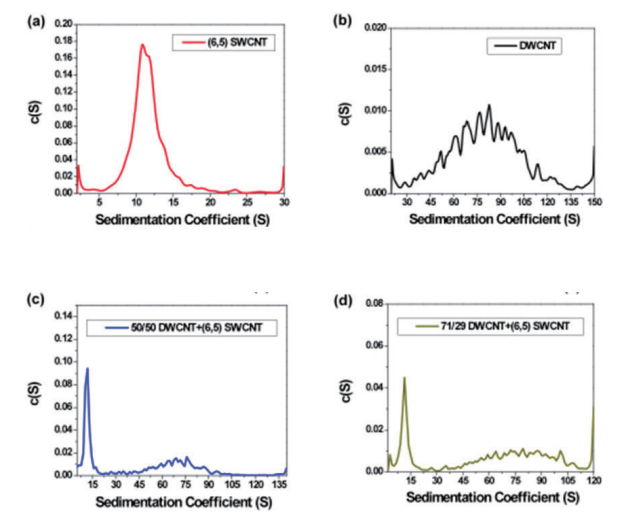
Fig. 10 Sedimentation coefficient distribution plot
(10a) (6, 5) chirality SWCNT: The sedimentation coefficient of (6, 5) chirality SWCNT is 11.3 S, and this value closely matches the literature value. Basically, the sedimentation coefficient of the particles contained within the (6, 5) SWCNT solution is less than 30 S.
(10b) DWCNT fractionated based on length: The sedimentation coefficient of the DWCNT that was fractionated based on length was 80.4 ± 25.6 S. Based on the broad spread, it is possible that part of the DWCNT is bundled. The sedimentation coefficient of the almost all of the particles that showed sedimentation within the DWCNT sample was at least 30 S.
(10c) 50/50 mixed solution of DWCNT and (6, 5) SWCNT: The DWCNT solution and (6, 5) SWCNT solution were mixed using equal volumes of material showing equivalent absorbance at 570 nm. Based on the sedimentation coefficient distribution, 50.4% of the total had a sedimentation coefficient between 5 ~ 30 S, with a mean value of 11.2 ± 5.2 S, while 49.6% had a sedimentation coefficient between 30 ~ 140 S, with a mean value of 70.2 ± 21.3 S.
(10d) 71/29 mixed solution of DWCNT and (6, 5) SWCNT: The DWCNT solution and (6, 5) SWCNT solution were mixed at a ratio of 71:29 for DWCNT: (6, 5) SWCNT, which showed equivalent absorbance at 570 nm. Based on the sedimentation coefficient distribution, 28.3% of the total had a sedimentation coefficient between 2 ~ 30 S, with a mean value of 12.5 ± 3.9 S, while 71.7% had a sedimentation coefficient between 30 ~ 120 S, with a mean value of 80.0 ± 21.0 S.
References
1. Baughman R H, Zakhidov A A, and de Heer W A. Carbon nanotubes—the route toward applications. Science. 297.5582; 787–792: (2002).
2. Che G et al. Carbon nanotubule membranes for electrochemical energy storage and production. Nature. 393.6683; 346–349: (1998).
3. Liu Z et al. Carbon nanotubes in biology and medicine: in vitro and in vivo detection, imaging and drug delivery. Nano research. 2.2; 85–120: (2009).
4. Lopez-Lorente A I, Simonet B M and Valcarcel M. Qualitative detection and quantitative determination of single-walled carbon nanotubes in mixtures of carbon nanotubes with a portable Raman spectrometer. Analyst. 138.8; 2378–2385: (2013).
5. Saito R. Physical properties of carbon nanotubes: (1998).
6. O’Connell M J et al. Band gap fluorescence from individual single-walled carbon nanotubes. Science. 297.5581; 593–596: (2002).
7. Liu H et al. Large-scale single-chirality separation of single-wall carbon nanotubes by simple gel chromatography. Nature Communications. 2; 309: (2011).
8. Zhang L et al. Assessment of chemically separated carbon nanotubes for nanoelectronics. Journal of the American Chemical Society. 130.8; 2686–2691: (2008).
9. Welsher K et al. A route to brightly fluorescent carbon nanotubes for near-infrared imaging in mice. Nature nanotechnology. 4.11; 773–780: (2009).
10. Liu Z et al. Supramolecular stacking of doxorubicin on carbon nanotubes for in vivo cancer therapy. Angewandte Chemie International Edition. 48.41; 7668– 7672: (2009).
11. Bhirde A A et al. Targeted killing of cancer cells in vivo and in vitro with EGF-directed carbon nanotube-based drug delivery. ACS nano. 3.2; 307–316: (2009).
12. Green A A, Duch M C and Hersam M C. Isolation of single-walled carbon nanotube enantiomers by density differentiation. Nano Research. 2.1; 69–77: (2009).
13. Komatsu N and Wang F. A comprehensive review on separation methods and techniques for single-walled carbon nanotubes. Materials. 3.7; 3818–3844: (2010).
14. Carney R P et al. Determination of nanoparticle size distribution together with density or molecular weight by 2D analytical ultracentrifugation. Nature Communications. 2; 335: (2011).
15. Falabella J B et al. Characterization of gold nanoparticles modified with single-stranded DNA using analytical ultracentrifugation and dynamic light scattering. Langmuir. 26.15; 12740–12747: (2010).
16. Antaris A L et al. Ultra-Low Doses of Chirality Sorted (6, 5) Carbon Nanotubes for Simultaneous Tumor Imaging and Photothermal Therapy. ACS nano. 7.4; 3644–3652: (2013).
17. Arnold M S et al. Hydrodynamic characterization of surfactant encapsulated carbon nanotubes using an analytical ultracentrifuge. ACS nano. 2.11; 2291–2300: (2008).
18. Tabakman S M et al. Optical properties of single-walled carbon nanotubes separated in a density gradient: length, bundling, and aromatic stacking effects. The Journal of Physical Chemistry C. 114.46; 19569–19575: (2010).
19. Hertel T et al. Spectroscopy of single-and double-wall carbon nanotubes in different environments. Nano letters. 5.3; 511–514: (2005).
20. Fagan J A et al. Analyzing Surfactant Structures on Length and Chirality Resolved (6, 5) Single-Wall Carbon Nanotubes by Analytical Ultracentrifugation. ACS nano. 7.4; 3373–3387: (2013).
