Echo System-Enhanced SMART-Seq v2 for RNA Sequencing
Application Note: Jefferson Lai, Anna Lehto, John Lesnick and Carl Jarman
Introduction
As next-generation sequencing continues to integrate and expand into core research functions, researchers are enabled to ask more questions about the transcriptome, with greater degrees of complexity. Synthetic biologists assess transcription levels in designer pathways, and single-cell researchers are comparing individual cell expression to populations. Consequently, the variety, quantity, and demands of RNA sequencing experiments have all increased. SMART-Seq v2, a method developed by Simone Picelli et al. at the Karolinska Institute, has become a ubiquitous method for single-cell and population RNA sequencing. Here, we demonstrate miniaturization of this process on human brain total RNA utilizing the Echo 525 Liquid Handler. We show that this enhanced process can effectively reduce reagent cost for the workflow, and see that genes are not differentially expressed across miniaturization and input variables as shown in Illumina RNAExpress analysis in BaseSpace. Across all our conditions, we see an average transcript total alignment to reference of 94% with a 1.6% CV. Thus, we provide an accurate and efficient platform to address current throughput and affordability needs of RNA sequencing.
OVERVIEW
SMART-Seq v2 Workflow to Generate cDNA Libraries
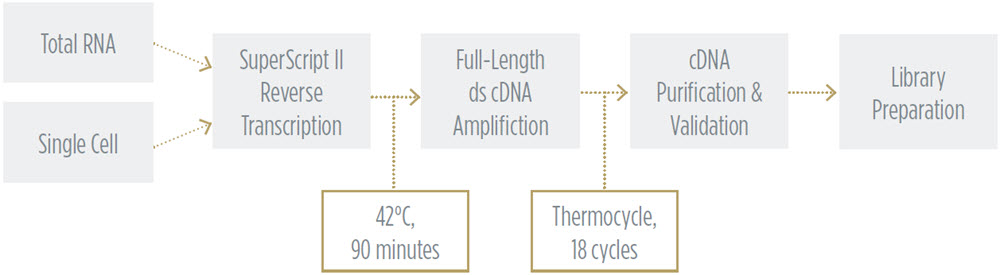
In this experiment, we aimed to cover conditions for applications ranging from total RNA of a cell population to single-cell RNA sequencing. We tested a matrix of variable sample input and reduced reaction volumes, looking for data uniformity across various situations. For this experiment, human brain total RNA from Invitrogen was purchased and used as the input sample. We utilized the Echo 525 Liquid Handler to transfer small, accurate, and precise amounts of sample and reagents throughout the workflow to achieve miniaturized reaction volumes. Details of this method are described in the methods section.
Nextera XT Library Preparation Workflow to Generate Libraries for Sequencing
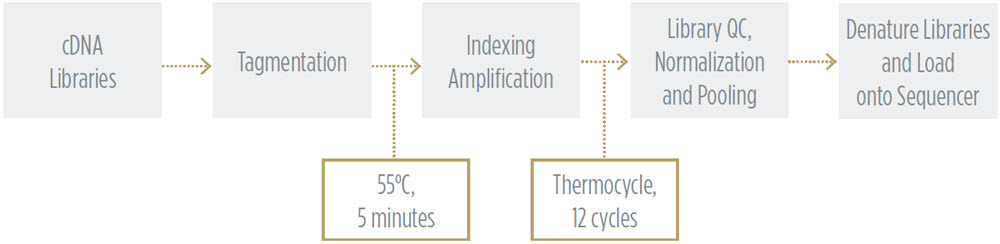
After QC of the cDNA library generated from the SMART-Seq v2 workflow, we processed the samples through Illumina Nextera XT library preparation for sequencing. Miniaturized Nextera XT conditions have been previously optimized, as detailed in Application Note G121, Effective Miniaturization of Illumina Nextera XT Library Prep for Multiplexed Whole Genome Sequencing and Microbiome Applications, as well as the publication “Low-cost, high-throughput sequencing of DNA assemblies using a highly multiplexed Nextera process. Shapland et al. ACS Synth. Biol., 2015.” The Echo 525 Liquid Handler was used throughout this workflow to transfer small, accurate, and precise amounts of sample and reagents to achieve miniaturized reaction volumes. Details of this method are described in the methods section.
Methodology
SMART-Seq v2 Workflow
Reaction volumes tested: 1/5, 1/10, 1/15, 1/20, 1/25
Input RNA (human brain total RNA) amounts tested: 10pg, 100pg, 300pg, 1000pg, 10ng
| Lysis | Protocol(μL/rxn) | 1/5 | 1/10 | 1/15 | 1/20 | 1/25 | Echo Calibration |
| 0.2% (vol/vol)Triton X-100 solution | 0.950 | 0.190 | 0.095 | 0.063 | 0.048 | 0.038 | |
| RNase Inhibitor | 0.050 | 0.010 | 0.005 | 0.003 | 0.003 | 0.002 | |
| dNTPs mix (10mM) | 1.000 | 0.200 | 0.100 | 0.067 | 0.050 | 0.040 | |
| Smart-dT30VN 100μM | 0.100 | 0.020 | 0.010 | 0.007 | 0.005 | 0.004 | |
| Total volume (for MM) | 2.100 | 0.420 | 0.210 | 0.140 | 0.105 | 0.084 | 384PP_AQ_SP_High |
| RNA/Cells+Water | 2.200 | 0.440 | 0.220 | 0.147 | 0.110 | 0.088 | |
| Total volume (per rxn) | 4.300 | 0.860 | 0.430 | 0.287 | 0.215 | 0.172 |
- Spin 700 g for 10 seconds at room temperature
- Incubate samples at 72°C for 3 minutes and immediately put back on ice (4°C)
- Spin 700 g for 10 seconds then put back on ice (4°C)
| 1st Strand cDNA Synthesis | Protocol(μL/rxn) | 1/5 | 1/10 | 1/15 | 1/20 | 1/25 | Echo Calibration |
| 5x SuperScript II buffer | 2 | 0.4 | 0.2 | 0.133 | 0.1 | 0.08 | |
| DTT (100mM) | 0.5 | 0.1 | 0.05 | 0.033 | 0.025 | 0.02 | |
| Betaine (5M) | 2 | 0.4 | 0.2 | 0.133 | 0.1 | 0.08 | |
| MgCl (1M) | 0.06 | 0.012 | 0.006 | 0.004 | 0.003 | 0.0024 | |
| RNase Inhibitor | 0.25 | 0.05 | 0.025 | 0.016 | 0.0125 | 0.01 | |
| LNA (100uM) (TSO) | 0.1 | 0.02 | 0.01 | 0.006 | 0.005 | 0.004 | |
| SuperScript II reverse transcriptase (200 U/ul) | 0.5 | 0.1 | 0.05 | 0.033 | 0.025 | 0.02 | |
| Water | 0.29 | 0.058 | 0.029 | 0.0193 | 0.0145 | 0.0116 | |
| Total volume (for MM) | 5.7 | 1.14 | 0.57 | 0.38 | 0.285 | 0.228 | 384PP_Plus_AQ_GPSA |
| Lysis (from above) | 4.3 | 0.86 | 0.43 | 0.286 | 0.215 | 0.172 | |
| Total volume (per rxn) | 10 | 2 | 1 | 0.667 | 0.5 | 0.4 |
- Spin 700 g for 10 seconds at room temperature
- Incubate samples at 42°C for 90 minutes
- Then incubate samples at 70°C for 15 minutes (enzyme inactivation)
- Hold samples at 4°C (safe storage)
| cDNA Amplification | Protocol(μL/rxn) | 1/5 | 1/10 | 1/15 | 1/20 | 1/25 | Echo Calibration |
| KAPA HiFi HS RM (2x) | 12.5 | 2.5 | 1.25 | 0.833 | 0.625 | 0.5 | |
| ISPCR (10μM) | 0.25 | 0.05 | 0.025 | 0.016 | 0.0125 | 0.01 | |
| Water | 2.25 | 0.45 | 0.225 | 0.15 | 0.1125 | 0.09 | |
| Total volume (for MM) | 15 | 3 | 1.5 | 1 | 0.75 | 0.6 | 384PP_Plus_AQ_GPSB |
| First-strand reaction | 10 | 2 | 1 | 0.667 | 0.5 | 0.4 | |
| Total volume (per rxn) | 25 | 5 | 2.5 | 1.667 | 1.25 | 1 |
- Spin 700g for 10 seconds at room temperature
| PCR reaction | Time | RNA Input (pg) | Equivalent Cell Input | Typical Number of PCR Cycles |
| 98°C | 3 min | 10 | 1 | 18 |
| 98°C | 20 sec | 100 | 10 | 15 |
| 67°C | 15 sec | 1,000 | 100 | 11 |
| 72°C | 6 min | 10,000 | 1,000 | 8 |
| 72°C | 5 min | |||
| 4°C | Forever |
SPRI bead cleanup was performed on the cDNA product, to minimize any interference with the Nextera XT process. SPRI bead cleanup followed the Agencourt AmpureXP PCR purification protocol for 384-well format. We utilized 1.8x beads for our variable volume cDNA amplification reaction and eluted in 20μL, taking 15μL into a 384LDVPlus plate for fragment size analysis and downstream miniaturized Nextera XT library preparation.
Library quantitation and fragment size analysis were performed to verify cDNA libraries and to normalize input into the Nextera XT process. The Picogreen fluorescence-based quantitation assay was used to determine the concentration of cDNA products. The Picogreen protocol was performed according to the ThermoFisher standard protocol, but volumes were miniaturized 1/100 from 2mL to 20μL in a Greiner 384-well clear-bottom plate. The Echo 525 Liquid Handler was used to dispense cDNA samples, standards, and Picogreen reagents. Results were read on the BMG Pherastar spectrophotometer. Fragment size analysis was performed on an Agilent TapeStation 2200 using a High-Sensitivity D5000 kit, with cDNA samples also dispensed by the Echo 525 Liquid Handler.
Nextera XT Workflow
| Tagmentation | Protocol (μL/rxn) | 1/10 | Echo Calibration |
| cDNA sample | 5 | 0.5 | 384PP_AQ_BP |
| TD buffer | 10 | 1 | 384PP_AQ_GP |
| ATM | 5 | 0.5 | 384PP_AQ_GPSB |
| Total volume | 20 | 2 | 384PP_AQ_GPSB |
- Spin
| Tagmentation reaction | |
| 55°C | 5 min |
| 10°C | Forever |
| Add NT | Protocol (μL/rxn) | 10-Jan | Echo Calibration |
| Tagmentation reaction | 20 | 2 | From previous |
| NT Buffer | 5 | 0.5 | 384PP_AQ_SPHigh |
| Total volume | 25 | 2.5 |
- Spin
- Incubate 5 min RT
| Indexing Amplification | Protocol (μL/rxn) | 1/10 | Echo Calibration |
| Tagmentation reaction | 25 | 2.5 | From previous |
| Indexing Primer 1 (100μM) (N7XX) | 5 | 0.05 | 384PP_AQ_BP |
| Indexing Primer 2 (100μM) (S5XX) | 5 | 0.05 | 384PP_AQ_BP |
| dH2O | 0 | 0.9 | 384PP_AQ_BP |
| NPM | 15 | 1.5 | 384PP_AQ_GPSB |
| Total volume | 50 | 5 | 384PP_AQ_GPSB |
| PCR reaction | |
| 72°C | 3 min |
| 95°C | 30 sec |
| 95°C | 10 sec |
| 55°C | 30 sec |
| 72°C | 30 sec |
| 72°C | 5 min |
| 4°C | Forever |
SPRI bead cleanup was performed on the post-Nextera XT library. SPRI bead cleanup followed the Agencourt AmpureXP PCR purification protocol for 384-well format. We utilized 9 μL (1.8x beads) for our 5μL amplification reaction, and eluted in 20 μL, taking 15μL into a 384LDVPlus plate for QC, normalization, and pooling.
Library QC is necessary to verify each sample and to ensure equimolar pooling of samples for sequencing. Fragment size analysis of the library pool was performed on the Agilent TapeStation 2200 using a High-Sensitivity D5000 kit, according to the Agilent standard protocol.
For our purposes, we seek even distribution of reads to all samples. To achieve equimolar pooling of all 100 samples, we first used the Echo 525 Liquid Handler to pool 200 nL of each sample and loaded a MiSeq v2 Nano 2x75 run. Then, based on the index distribution results, we created a normalized worklist. The Echo 525 Liquid Handler was then used to simultaneously pool and normalize the libraries in two minutes. The pool was then denatured and diluted to 20 pM, loaded with 1% PhiX control, and run on Illumina MiSeq v3 reagents specifying 2x75 reads.
Results and Discussion
Reproducible sample preparation is dependent on the quality of the input material. Evaluation of starting total RNA quality is important. In this experiment, we used Invitrogen human brain total RNA reference material purchased from ThermoFisher. We independently verified the integrity of the RNA using the Agilent TapeStation 2200 with an RNA kit (Figure 1). Sequence complexity and average length of the cDNA can be affected by quality and quantity of the starting material. When FACS sorting single cells, avoid transferring the culture medium into the lysis buffer. Where possible, wash and resuspend cells in PBS prior to lysis to avoid inhibition of the first-strand cDNA synthesis reaction.
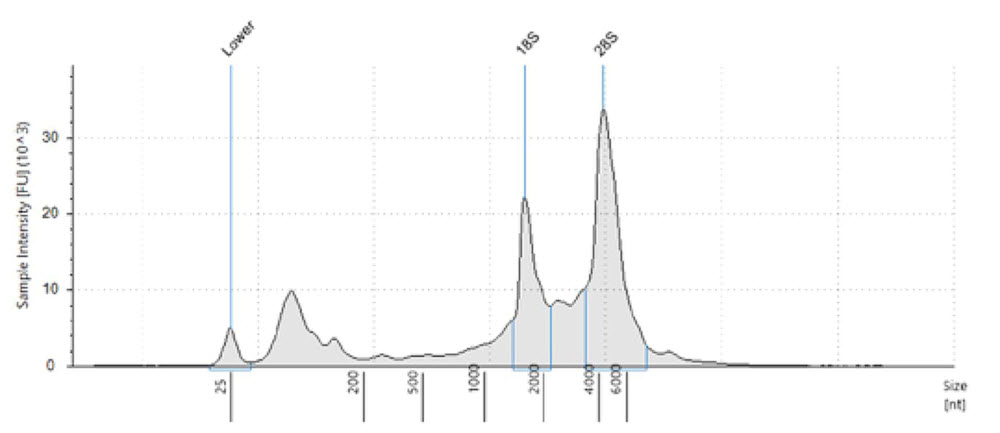
Figure 1. Electropherogram of the human brain total RNA used as input. Fragment analysis was run on Agilent TapeStation 2200 with the RNA kit. RIN is 8.6, demonstrating intact and quality input material..
During second strand cDNA synthesis determine the optimal number of PCR cycles for your starting material based on the guidelines given above. It is not uncommon for the number to increase by 3-5 cycles above the recommended number, as optimal conditions vary amongst cell types.
After running our matrix of sample conditions (RNA input and reaction miniaturization) through the SMART-Seq v2 process, we then performed SPRI bead cleanup and quantitated all cDNA libraries. We were aiming to achieve a minimum cDNA library concentration of 0.2ng/μL, in order to have at least 0.1 ng total DNA going into a 2.5μL tagmentation reaction (Figure 2, Figure 3).
cDNA Yield
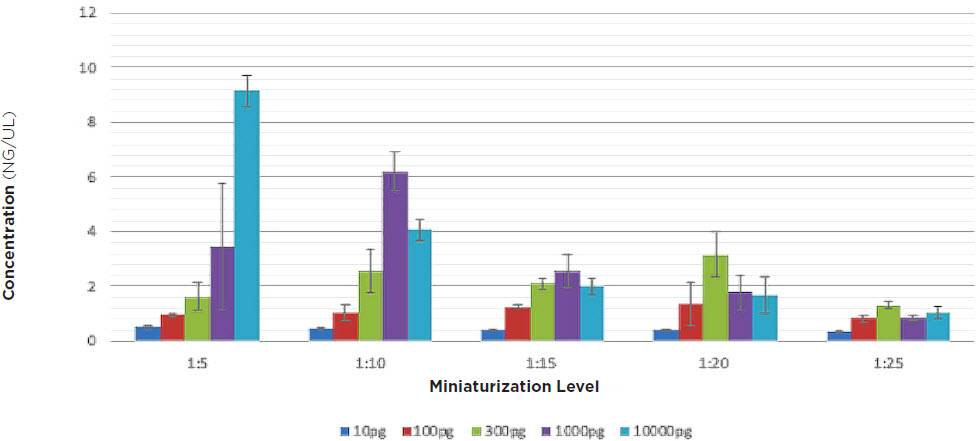
Figure 2. cDNA library yields for each condition, after 18x cycling of second strand cDNA synthesis, and SPRI bead cleanup. On the low end, 10pg RNA input and 1:25 miniaturization, there is just enough cDNA (0.2ng/μL) for Nextera XT. In all other scenarios, excess cDNA was produced, indicating it is possible to lower the amount of thermocycling for certain experiments.
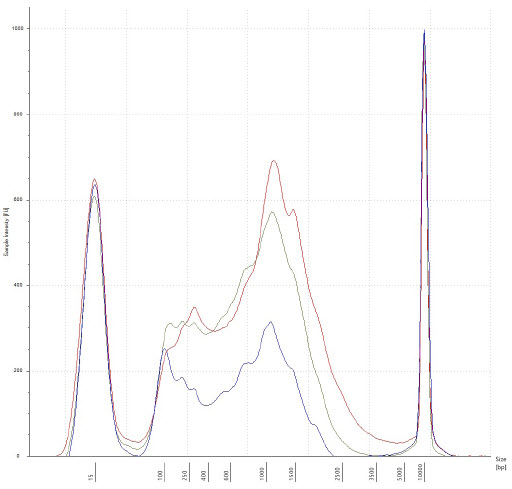
Figure 3. Electropherogram of a few cDNA samples, after 18x cycling of second strand cDNA synthesis, and SPRI bead cleanup. Traces represent 10pg, 100pg, and 1000pg input in blue, yellow, and red, respectively. There is intact cDNA in all three examples, with the median of transcripts occurring approximately 1500bp in length.
We picked all samples from the 18x cycle plate and processed them through our Echo Liquid Handler-enhanced Nextera XT workflow. On the low end, at 10pg RNA input and 1:25 miniaturization, there is just enough cDNA (0.2ng/μL) for Nextera XT. In all other scenarios, excess cDNA was produced, indicating it is possible to lower the amount of thermocycling for certain experiments. Experiments looking to minimize amplification bias stand to benefit the most from decreasing amount of thermocycling. Fragment size analysis of representative samples of cDNA were run on an Agilent TapeStation 2200 with a High-Sensitivity D5000 kit, and we see intact libraries and the median of transcripts occurring at approximately 1500bp.
Nextera XT reagents and cDNA libraries were transferred in 1/10 volume of the recommended protocol by the Echo 525 Liquid Handler. After the Nextera XT library preparation, individual libraries were cleaned using SPRI beads. An equal-volume 200nL pool of all 100 samples was prepared for library QC. We ran a small portion of this pool on the Agilent TapeStation 2200 using a D5000 kit for average fragment size analysis. We see average fragment size of about 350bp, which is sufficient length for our 2x75 paired-end sequencing strategy (Figure 4).
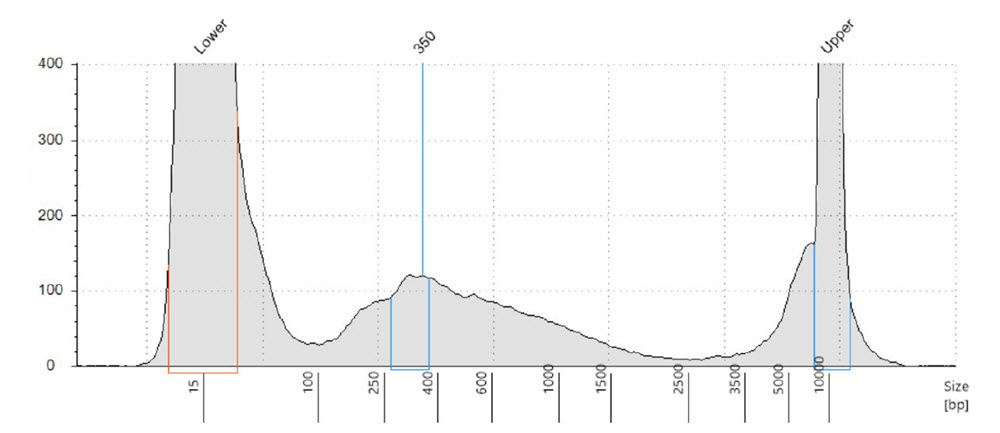
Figure 4. Electropherogram of the Nextera XT library pool. This equal volume pool was created by using the Echo 525 Liquid Handler to transfer 200 nL of each sample to a well. Pool was run on an Agilent TapeStation 2200 with a D5000 kit. We see average fragment size of about 350 bp.
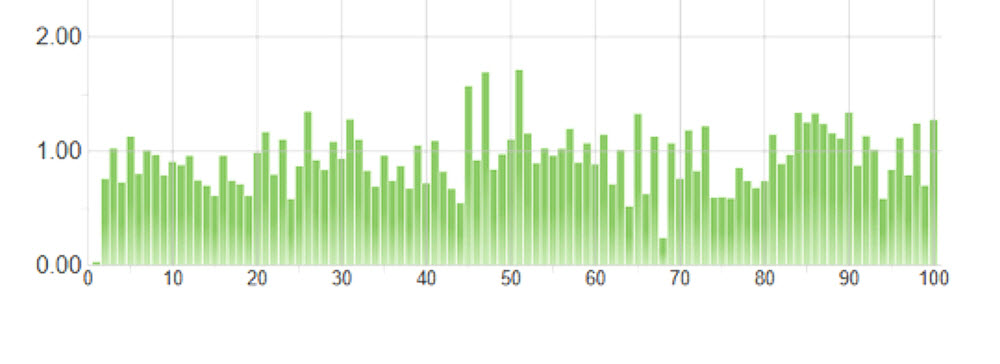
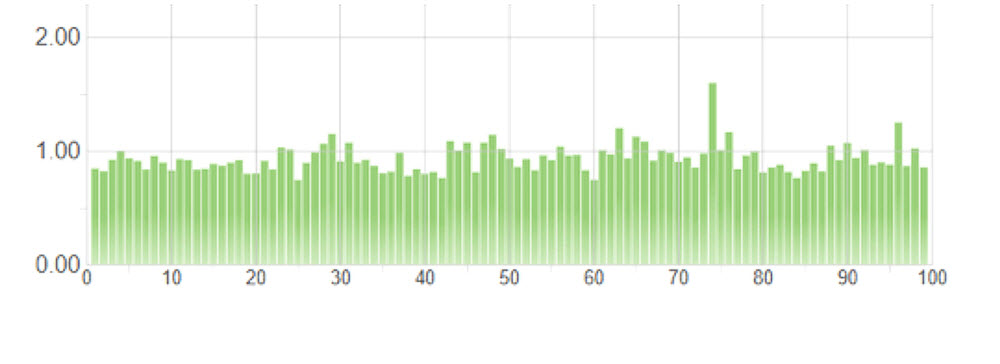
The equal-volume pool was also used as a tool for normalizing sample representation. We took 5 μL of this pool and loaded an Illumina MiSeq using a v2 Nano kit specifying 2x75 paired-end reads. Unsurprisingly, we saw variation in the distribution of reads to sample, theorizing sample-to-sample variation arises from different reaction conditions and varying SPRI bead cleanup efficiencies. The CV of this equal-volume pool is 28.9% (Figure 5). Using this information, we set the highest represented sample to the maximum, and compiled a normalization worklist to add volume to match the quantity of the maximum. The Echo 525 Liquid Handler was able to normalize and pool the samples in 2 minutes, per transfer logs given by the Echo system. We then loaded this normalized pool on an Illumina MiSeq using a v3 kit specifying 2x75 paired-end reads for deeper sequencing. CV for the normalized pool was 13.2%, a drastic improvement in normalized coverage per sample (Figure 6).
Index Number
Figure 5. llumina index distribution graph of 100 RNASeq samples, 200nL equal-volume pooling achieved via Echo 525 Liquid Handler, and run on an Illumina MiSeq with v2 Nano kit specifying 2x75 paired-end reads. CV is 28.9%.
Index Number
Figure 6. Illumina index distribution graph of 100 RNASeq samples, equimolar pooling achieved via Echo 525 Liquid Handler, and run on an Illumina MiSeq with v3 kit specifying 2x75 paired-end reads. CV is 13.2%.
The Illumina MiSeq v2 Nano kit can be used in place of traditional fluorescent dye-based quantitation of libraries and is fast and affordable. Using the v2 Nano kit for quantitation gives index distribution, the output that is directly correlated to read distribution per sample. Fluorescent dye-based quantitation can overestimate this by measuring the total DNA in the well, more than what eventually binds to the flow cell. An identical process is also being utilized for Illumina’s patterned flow cells, most recently using an iSeq 100 to measure a pooled library before large-scale sequencing on the NovaSeq 6000 (Illumina App Note 770-2018-019-A). We see our correlation between v2 and v3 kits to be above 0.8, which falls in line with Illumina’s observations with patterned flow cells.
MiSeq run metrics were within specifications and 93.5% of the data is between Q30 and Q40, indicating quality, reliable reads from the instrument (Figure 7).
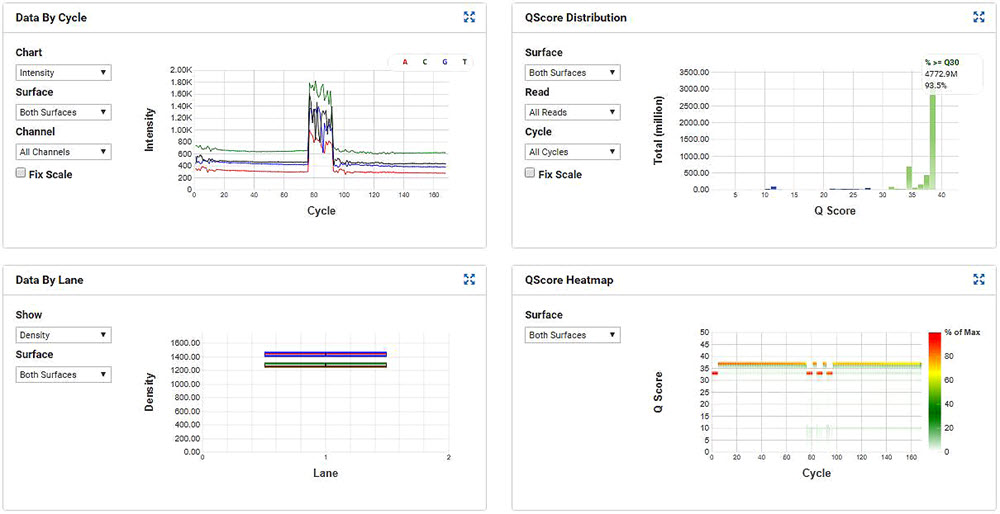
Figure 7. MiSeq run metrics of the SMART-Seq v2 samples that were processed through miniaturized Nextera XT.
To assess whether SMART-Seq v2 reaction volume and RNA input quantity would reproduce transcription levels across those variables, we ran these samples through the Illumina BaseSpace application, RNA Express. This pipeline performs three major steps: alignment of RNA-Seq reads with the STAR aligner, assignment of aligned reads to genes, and differentiating gene expression with DESeq2. One set of replicates was chosen, at random, to be the control group, to which all other samples are referenced.
Figure 8 represents summary statistics from the RNA Express analysis. It shows that in this dataset, 1,503 genes were assessed, and we do not have any statistically significant differentially expressed genes, which we expect given all samples were sourced from the same RNA. In addition to this top line, the analysis also reported an average total alignment of reads to human brain reference to be 94.03% with a 1.64% CV across samples, multi-mapped reads of 16.49% with a CV of 20.20%, and reads with spliced alignment of 17.56% with 11.14% CV. Certainly, using a higher capacity sequencer with longer read lengths can improve the genes assessed, and reduce the multi-mapping and spliced alignment effects. In our experiment utilizing the MiSeq and v3 reagents, we were able to achieve an average of 300,000 reads per sample.
Differential Expression
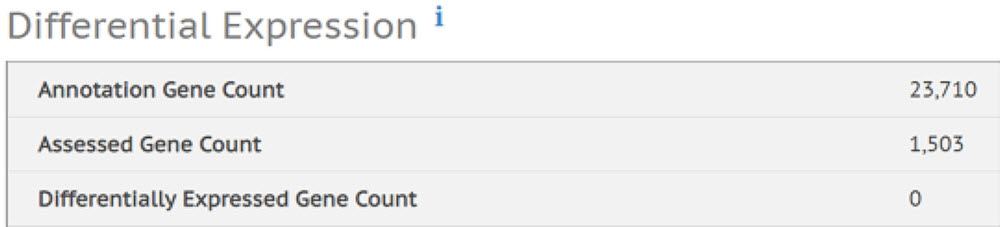
Figure 8. Summary statistics from the RNA Express software pipeline in Illumina BaseSpace. It shows that in this data set, 1,503 genes were assessed, and the software found 0 of them to be differentially expressed.
Figure 9 shows that expression largely differs less than two-fold, which the software calls as no statistical difference in expression. The software also requires a mean gene count of at least 10 to be significant. The graph also shows that with higher mean count of a certain transcript, the variation drops. In Figure 10 the sample correlation matrix shows a heatmap with the relative similarity between all replicates in this analysis. Each row and column represents one replicate, ordered by similarity (hierarchical clustering). The color of each field indicates the Spearman Rho correlation between these replicates. A dark orange color represents a correlation of 1 and lightening up to green and white indicates a correlation of -1. We see very strong positive correlation for the transcripts across samples.
This gives us confidence that our Echo system-enhanced SMART-Seq v2 process can be used with a variety of sample input amounts and miniaturization levels, and with a sufficient amount of cycling, to generate cDNA libraries. We further show that our miniaturized Nextera XT process can produce quality data and good sequencing metrics. We demonstrate the ability of a small-scale and affordable sequencing kit like the MiSeq v2 Nano, when used with the Echo 525 Liquid Handler, to provide accurate and quick quantitation of libraries for QC, normalization, and pooling. Finally, the analysis shows that the entire process does not introduce significant bias to transcript levels in this RNA-seq experiment.
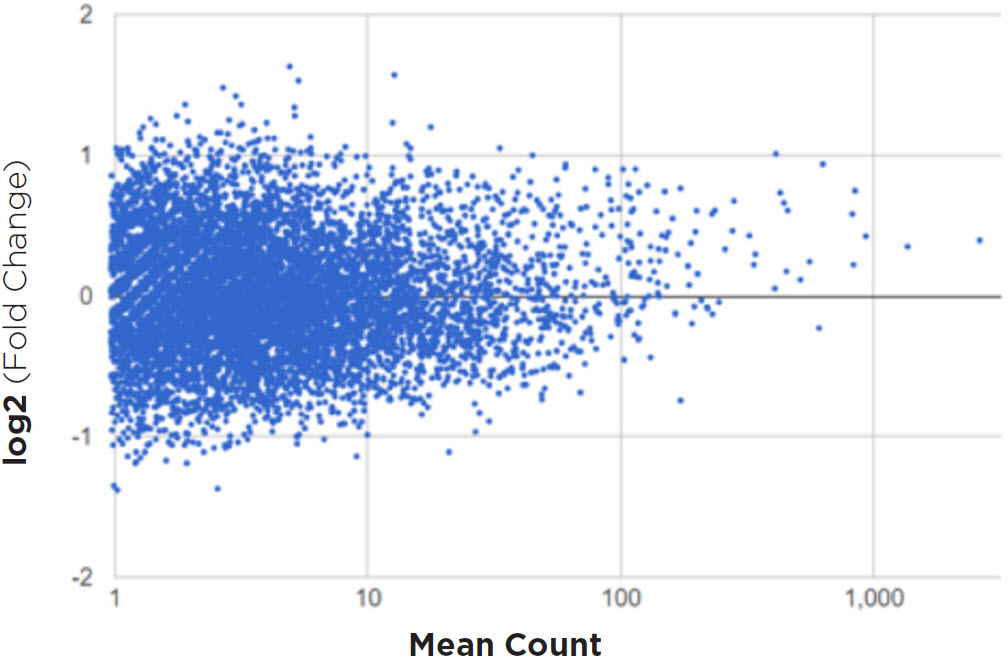
Figure 9. This dot plot graph shows all the assessed genes compared to the randomly chosen control replicates. We see that the expression largely differs less than two-fold, which the software calls as no statistical difference in expression. We also see that as the mean gene count increases (moving right), the variation in expression decreases and approaches log 0.
Sample Correlation Matrix
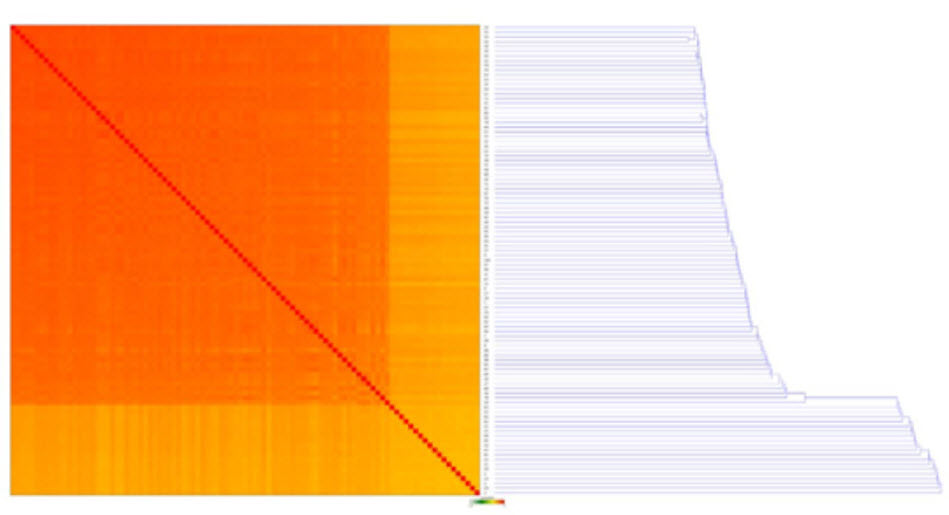
Figure 10. A Sample Correlation Matrix, showing a heatmap with the relative similarity between all replicates in this analysis. Each row and column represents one replicate, ordered by similarity (hierarchical clustering). The color of each field indicates the Spearman Rho correlation between these replicates. Dark orange is a correlation of 1 and lightening up to green and white indicates a correlation of -1.
Conclusions
As scientists continue to push the limits of our genomics tools and understandings, RNA sequencing experiments are growing in quantity, variety, and experimental demands. We see diversity in the questions being asked, as well as the inputs for experimental analysis, so we aimed to determine parameters for producing sufficient amounts of quality sequencing data at a cost-effective volumetrically-reduced process.
We found that miniaturization of SMART-Seq v2 up to 25-fold can produce sufficient library for sequencing, though the level of miniaturization should be chosen based on labware, workflow, and experimental needs. We also see that variables of input RNA, reaction miniaturization, and amount of PCR cycling are all interconnected. For example, high-input RNA experiments will produce excess library at 18x PCR cycling, thus less thermocycling can be used. Increasing sample RNA input or reaction volume will reduce the amount of PCR cycling necessary (and subsequent PCR bias), but the reagent cost savings will be less drastic. It is very much up to the user and the defined experiment to balance the cost-savings and throughput in SMART-Seq v2.
Materials
| Equipment | Manufacturer | |
| Echo 525 Liquid Handler | Beckman Coulter Life Sciences | |
| Allegra X-14 Centrifuge | Beckman Coulter Life Sciences | |
| MixMate | Eppendorf | |
| Qubit | ThermoFisher | |
| TapeStation 2200 | Agilent | |
| BMG PHERAstar | BMG Labtech | |
| ProFlex PCR System | ThermoFisher | |
| 384-well Post Magnet Plate | Alpaqua | |
| MiSeq | Illumina | |
| Reagents | Manufacturer | Part Number |
| SMART-Seq v4 Ultra Low Input RNA Kit | Clontech | 634892 |
| Human Brain Total RNA | ThermoFisher | AM7962 |
| NexteraXT DNA 96-Sample Prep Kitt | Illumina | FC-131-1096 |
| NexteraXT Index Kit v2 Set A | Illumina | FC-131-2001 |
| PhiX Control v3 | Illumina | FC-110-3001 |
| KAPA HiFi HotStart ReadyMix (2X) | KAPA Biosystems | KK2602 |
| 16S rRNA V4 Region Primers | Integrated DNA Technologies | Custom Oligos |
| TapeStation D1000 HS Kit | Agilent | #5067-5584, #5067-5585 |
| Qubit dsDNA HS Assay Kit | ThermoFisher | #Q32851 |
| Quant-iT Picogreen dsDNA Assay Kit | ThermoFisher | #P11496 |
| AMPure XP | Beckman Coulter Life Sciences | #A63881 |
| 200 Proof Ethanol | Sigma Aldrich | #E7023 |
| MiSeq Reagent Kit v3 (600-cycle) | Illumina | MS-102-3003 |
| Consumables | Manufacturer | Part Number |
| 384-well PP Microplate | Beckman Coulter Life Sciences | #001-12380 |
| 384-well LDV Plus Microplate | Beckman Coulter Life Sciences | #001-13070 |
| TapeStation Plate | Agilent | #5067-5150 |
| Qubit Microtube | ThermoFisher | #Q32856 |
| 384-well PCR Plate | Bio-Rad | #HSP3805 |
| 384-well Black Flat Clear-bottom Microplate | Greiner | #781096 |
| 1.5mL DNA LoBind Tubes | Eppendorf | #022431021 |
Beckman Coulter Life Sciences liquid handlers are not intended or validated for use in the diagnosis of disease or other conditions.
